

What is the Product Carbon Footprint (PCF)?
The Product Carbon Footprint (PCF) quantifies the greenhouse gas emissions attributed to a product within defined system boundaries. Depending on the approach used, it may cover different stages of the product life cycle—from raw material extraction and manufacturing to transport, use, disposal and recycling.
The PCF is usually expressed in CO_2 equivalents per defined unit of product. It provides information about a product’s climate-related impact but does not cover other environmental impacts. Product comparisons are meaningful only if the values have been calculated using the same methodology and comparable system boundaries, units and data sources.
The calculation includes direct and indirect greenhouse gas emissions that fall within the selected system boundaries. These may include emissions from energy supply, raw material extraction, manufacturing and transport.
The use of secondary tin can for example reduce raw material-related greenhouse gas emissions compared with the use of primary tin.
What is our motivation?
What is our motivation?
With the PCF, we aim to provide our customers with greater transparency regarding product-related greenhouse gas emissions. For more than 1,600 products—representing nearly 100% of the goods we manufacture in-house—we disclose the emissions calculated within the defined cradle-to-gate system boundaries.
The calculation and disclosure of these PCF values are currently voluntary. In doing so, we address our customers’ requirements and provide transparent information on product-related greenhouse gas emissions. At the same time, the calculations help us identify emissions-intensive areas and assess potential reduction measures.
For our business partners, the PCF values can provide an additional basis for purchasing decisions and their own greenhouse gas accounting. This requires the calculation methods, system boundaries and underlying data to be compatible.
What is the so-called system boundary?
The PCF comprises the total greenhouse gas emissions caused by a product in the various phases of its life cycle.
A distinction is made here between different approaches to the system boundary:
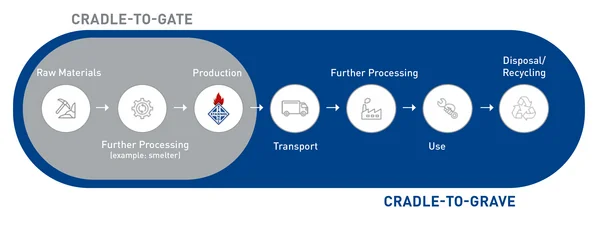
A Cradle-to-Gate PCF for example, takes into account all processes from the extraction of resources/raw materials to the manufacture of preliminary products and the production of the end product right up to the point at which the product leaves the company.
A Cradle-to-Grave PCF covers the entire life cycle of the product, including emissions from the utilisation phase and the end of the product's life.
The Product Carbon Footprint disclosed by Stannol is based on a cradle-to-gate approach. It covers the greenhouse gas emissions attributed to the product from raw material extraction to the point at which it leaves the Stannol site.
This approach covers only part of the product’s full life cycle. After leaving the site, our products are used in various downstream industrial processes at OEM and EMS companies and in a range of end applications. As sufficiently robust and consistent data is not available for these downstream stages, they are not included in the disclosed PCF.
Product life cycle

For which products do we report the PCF?
Stannol reports the PCF for over 1,600 manufacturing products, i.e. for almost 100 percent of the goods manufactured in-house in the product areas
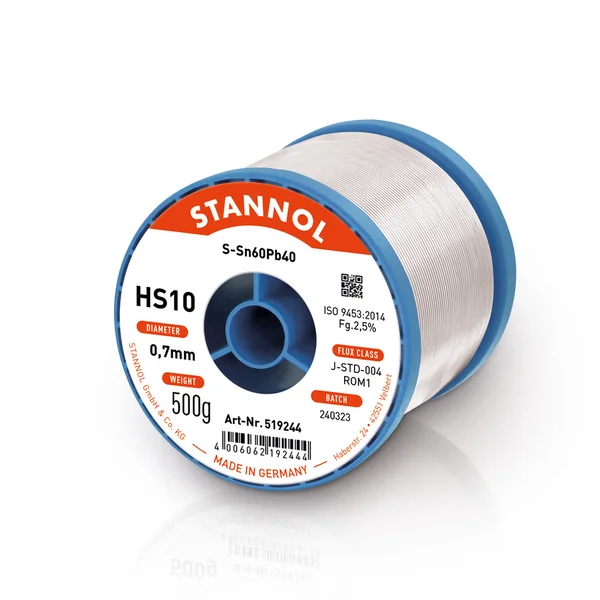
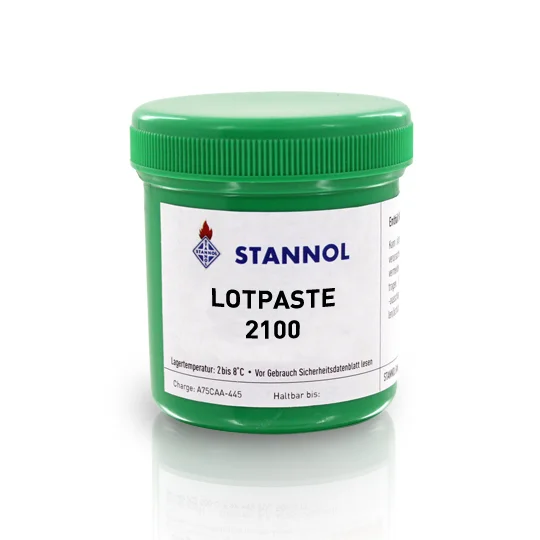
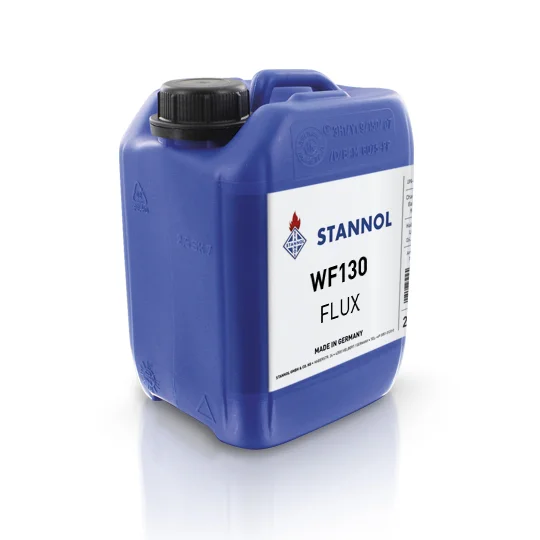
The emission values are shown on the business documents (quotation, order confirmation, delivery note and invoice) at item level in kg CO2e per unit of quantity and as a total emission quantity for the respective order.
If you require the product carbon footprint for your annual order quantity or another defined period in the above-mentioned product areas, we will be pleased to provide you with this information on request.
What is our data base?
The partial Product Carbon Footprint is calculated using primary and secondary data.
To collect primary data, we involved our suppliers and asked them to provide and confirm product- or raw material-specific figures. The secondary data comes from public and commercial emissions databases, including GEMIS, BAFA and EstiMol.
Where suitable database values or supplier data are not available for individual raw materials, we use documented proxy values for comparable raw materials. Due to the associated data uncertainty, these values are calculated with a defined safety margin. The relevant assumptions and calculation bases are documented.
The underlying data and its availability may change over time. We therefore reserve the right to update the disclosed values when new or improved data become available. Improved data provision throughout the supply chain may also increase the accuracy of the calculations.
Stannol is committed to ongoing dialogue with supply chain participants in order to further develop the data basis and traceability of its PCF calculations.
If you have any questions about the PCF, please contact Stannol Sales or our Sustainability Officer, Susanne Schlüter.
The PCF process

If you have any questions, please do not hesitate to contact us